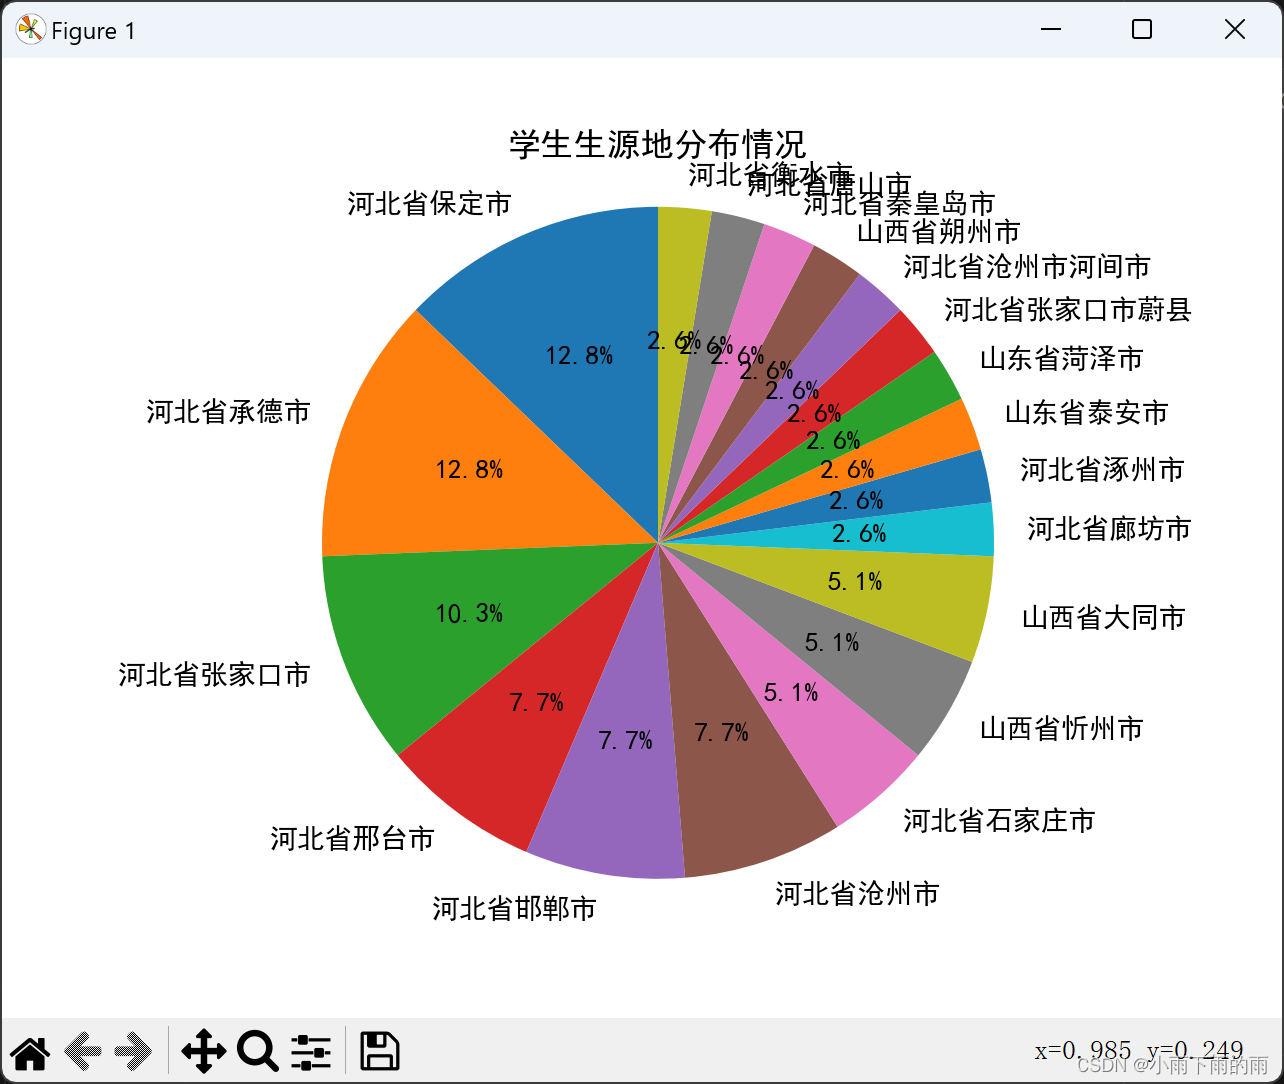
实际效果:
实际代码:
import pandas as pd
import matplotlib.pyplot as plt

# 读取Excel文件
try:
    df = pd.read_excel('学生详细信息模板.xlsx')
    print("成功读取Excel文件!")

    # 假设我们要分析'生源地'列的数据分布情况
    profession_column = '生源地'  # 替换为你的实际列名

    # 检查列是否存在于DataFrame中
    if profession_column not in df.columns:
        raise ValueError(f"列 '{profession_column}' 不存在于DataFrame中。")

    # 计算每个生源地的数量
    profession_counts = df[profession_column].value_counts()

    # 设置支持中文的字体
    plt.rcParams['font.sans-serif'] = ['SimHei']  # 使用黑体
    plt.rcParams['axes.unicode_minus'] = False  # 正确显示负号

    # 绘制饼形图
    fig, ax = plt.subplots()
    ax.pie(profession_counts, labels=profession_counts.index, autopct='%1.1f%%', startangle=90)

    # 设置图表标题(这里也使用中文)
    ax.set_title('学生生源地分布情况')

    # 确保饼形图是圆的,而不是椭圆形的
    ax.axis('equal')

    # 显示图表
    plt.show()

except FileNotFoundError:
    print("文件未找到,请检查文件路径是否正确。")
except Exception as e:
    print(f"读取文件或制作饼形图时发生错误: {e}")