1.下载与查看MNIST数据集
from keras.datasets import mnist

(x_train_image,y_train_label),(x_test_image,y_test_label) = mnist.load_data()
print("train images:",x_train_image.shape)
print("test images:",x_test_image.shape)
print("train labels:",y_train_label.shape)
print("test labels:",y_test_label.shape)
代码下载数据集后,会将数据保存在四个集合中,分别为:
- x_train_image:保存训练数字图像,共60000个。
- y_train_label:保存训练数字图像的正确数字,共60000个。
- x_test_image:保存测试数字图像,共10000个。
- y_test_label:保存测试数字图像的正确数字,共10000个。
- 数据保存位置’~/.keras/datasets/'+path
2.图像绘制
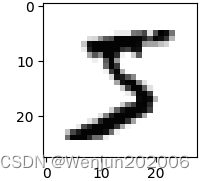
image是一副28*28的灰度图片,数组中每一个单元的数值在0~255之间。其中0表示白色,255表示黑色。
import matplotlib.pyplot as plt
def plot_image(image):
    fig = plt.gcf()
    fig.set_size_inches(2,2)
    plt.imshow(image,cmap='binary')
    plt.show()
plot_image(x_train_image[0])
print(y_train_label[0])
print(x_train_image[0])
3.绘制多张图像
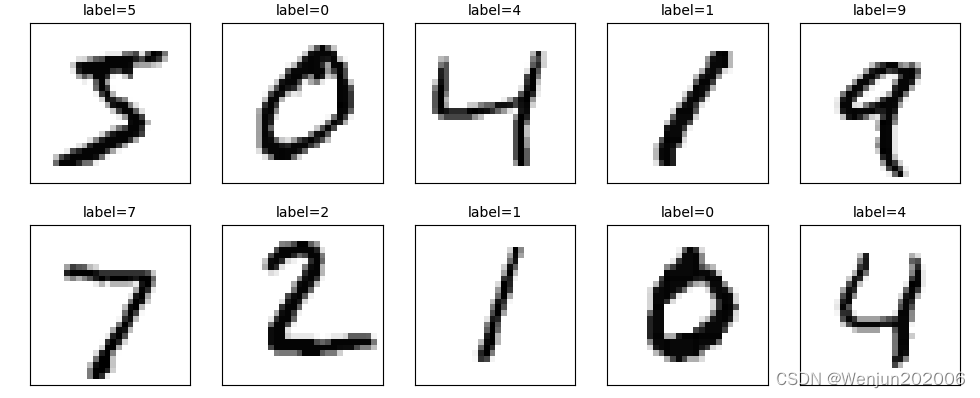
def plot_images_lables(images,labels,start_idx,num=5):
    fig = plt.gcf()
    fig.set_size_inches(12,14)
    for i in range(num):
        ax = plt.subplot(1,num,1+i)
        ax.imshow(images[start_idx+i],cmap='binary')
        title = 'label=' + str(labels[start_idx+i])
        ax.set_title(title,fontsize=10)
        ax.set_xticks([])
        ax.set_yticks([])
    plt.show()
plot_images_lables(x_train_image,y_train_label,0,5)
plot_images_lables(x_test_image,y_test_label,0,5)