介绍
方格状态的箱线图
加载R包
knitr::opts_chunk$set(echo = TRUE, message = FALSE, warning = FALSE)
library(patternplot)
library(png)
library(ggplot2)
library(gridExtra)

rm(list = ls())
options(stringsAsFactors = F)
导入数据
data <- read.csv(system.file("extdata", "fruits.csv", package = "patternplot"))
准备数据
group <- data$Fruit
y <- data$Weight
x <- data$Store
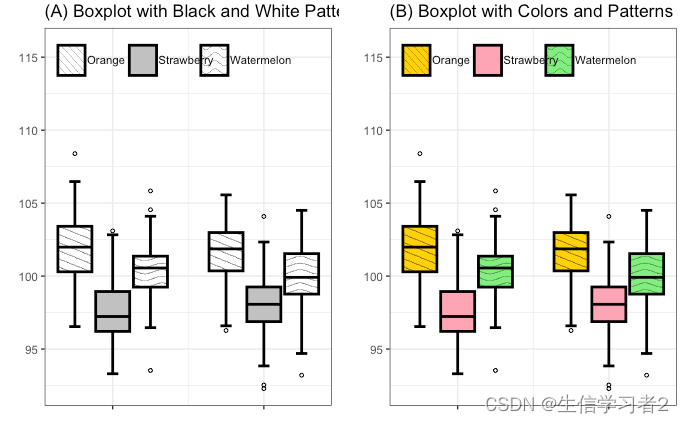
pattern.type <- c('nwlines', 'blank', 'waves')
pattern.color <- c('black','black', 'black')
background.color <- c('white','gray80', 'white')
frame.color <- c('black', 'black', 'black')
pattern.line.size <- c(6, 1,6)
density <- c(6, 1, 8)
画图
box1 <- patternboxplot(
  data, x, y, group = group,
  pattern.type = pattern.type,
  pattern.line.size = pattern.line.size,
  label.size = 3,
  pattern.color = pattern.color,
  background.color = background.color,
  frame.color = frame.color,
  density = density,
  legend.h = 2,
  legend.x.pos = 1.075,
  legend.y.pos = 0.499,
  legend.pixel = 10,
  legend.w = 0.18,
  legend.label = c("Orange","Strawberry","Watermelon")) +
  ggtitle('(A) Boxplot with Black and White Patterns')

pattern.color <- c('black','white', 'grey20')
background.color <- c('gold','lightpink', 'lightgreen')

box2 <- patternboxplot(
  data, x, y, group = group,
  pattern.type = pattern.type,
  pattern.line.size = pattern.line.size,
  label.size = 3,
  pattern.color = pattern.color,
  background.color = background.color,
  frame.color = frame.color,
  density = density,
  legend.h = 2,
  legend.x.pos = 1.075,
  legend.y.pos = 0.499,
  legend.pixel = 10,
  legend.w = 0.18,
  legend.label = c("Orange","Strawberry","Watermelon")) +
  ggtitle('(B) Boxplot with Colors and Patterns')

grid.arrange(box1, box2, nrow = 1)