介绍
方格状态的柱状图
加载R包
knitr::opts_chunk$set(echo = TRUE, message = FALSE, warning = FALSE)
library(patternplot)
library(png)
library(ggplot2)
library(gridExtra)

rm(list = ls())
options(stringsAsFactors = F)
导入数据
data <- read.csv(system.file("extdata", "monthlyexp.csv", package="patternplot"))
准备数据
data <- data[which(data$Location == 'City 1'), ]
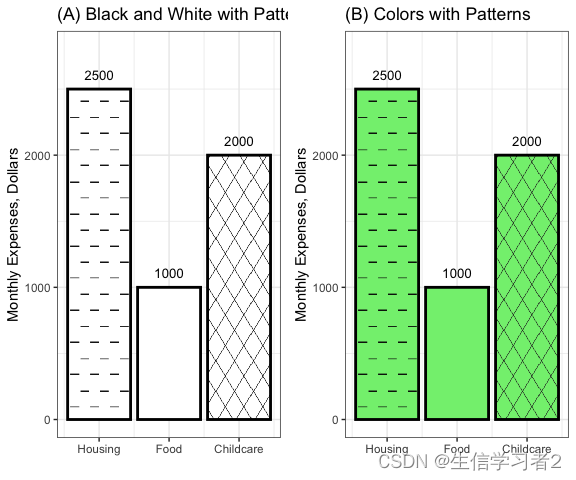
x <- factor(data$Type, c('Housing', 'Food', 'Childcare'))
y <- data$Amount
pattern.type <- c('hdashes', 'blank', 'crosshatch')
pattern.color <- c('black', 'black', 'black')
background.color <- c('white','white', 'white')
density <- c(20, 20, 10)
画图
barp1 <- patternbar(
  data, x, y,
  group = NULL,
  ylab = 'Monthly Expenses, Dollars',
  pattern.type = pattern.type, hjust=0.5,
  pattern.color = pattern.color,
  background.color = background.color,pattern.line.size = c(5.5, 1, 4),
  frame.color = c('black', 'black', 'black'),
  density = density) +
  scale_y_continuous(limits = c(0, 2800)) +
  ggtitle('(A) Black and White with Patterns')

pattern.color <- c('black','white', 'grey20')
background.color <- c('lightgreen','lightgreen', 'lightgreen')
barp2 <- patternbar(
  data, x, y,
  group = NULL,
  ylab = 'Monthly Expenses, Dollars',
  pattern.type = pattern.type, hjust=0.5,
  pattern.color = pattern.color,
  background.color = background.color,
  pattern.line.size = c(5.5, 1, 4),
  frame.color = c('black', 'black', 'black'),
  density = density) +
  scale_y_continuous(limits = c(0, 2800)) +
  ggtitle('(B) Colors with Patterns')


grid.arrange(barp1,barp2,  nrow = 1)